When it comes to promising forms of energy, nuclear fusion ticks all the boxes: it’s clean, abundant, continuous and safe.
It occurs when the light nuclei of two atoms fuse together to form a heavier nucleus, releasing large amounts of energy in the process.
For fusion reactions to proceed in a controlled manner, huge reactors are needed in the form of giant rings that are filled with magnets to create magnetic fields where atomic particles buzz around and dance like a swarm of bees.
Difficult to image? The good news is that you can now watch a live simulation of this kind of reactor – called a tokamak – thanks to amazingly realistic 3D visualization technology.
At EPFL, the Experimental Museology Laboratory (EM+) specializes in this technology and has developed a program that turns the terabytes of data generated by the tokamak simulations and testing performed by EPFL’s Swiss Plasma Center (SPC) into an immersive 3D visualization experience .
For the general public, the visualization is a journey in a circle of fireworks illustrating a possible future source of energy; for scientists, it is a valuable tool that makes the complex phenomena of quantum physics tangible and helps them grasp the results of their calculations.
The images are so accurate that they show wear
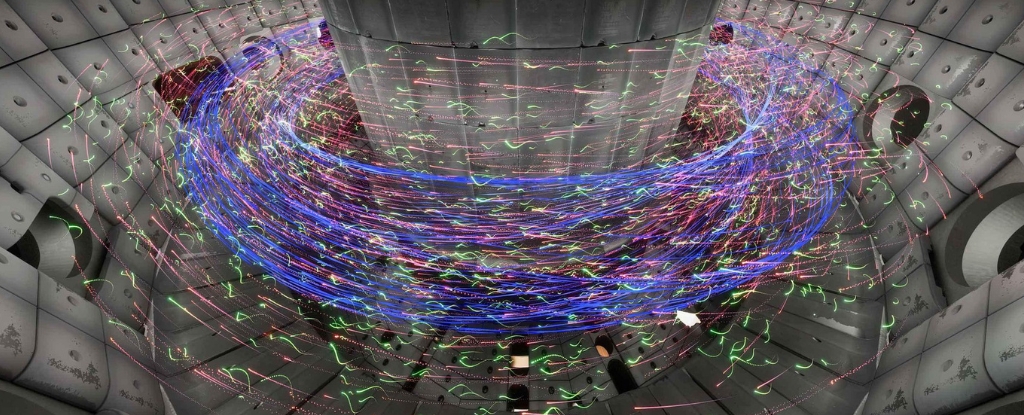
The 3D visualization – a panorama measuring 4 meters high and 10 meters in diameter – is a faithful reproduction of the interior of EPFL’s Variable Configuration Tokamak (TCV), rendered in such stunning detail that it rivals even the highest quality gaming experience.
The experimental reactor was built more than 30 years ago and is still the only one of its kind in the world.
“We used a robot to generate ultra-high-precision scans of the inside of the reactor, which we then compiled to produce a 3D model that reproduces its components down to their texture,” says Sami Mannan, a computer scientist at EM+.
“We were even able to capture the wear and tear of the graphite tiles lining the reactor walls, which are subjected to extremely high temperatures during the TCV test runs.”
SPC engineers provided equations to calculate exactly how quantum particles move at a given moment in time. The EM+ researchers then incorporated these equations, along with the reactor data, into their 3D visualization system. The catch is that all calculations must be done in real time.
“To create just one image, the system must calculate the trajectories of thousands of moving particles at a rate of 60 times per second for each eye,” Manane says.
This massive number crunching is done by five computers with 2 GPUs each that EM+ acquired for this project. The output from the computers is fed into the panorama’s five 4k projectors.
“We were able to build our system thanks to advances in infographic technology,” says Sarah Kenderdine, the professor who leads EM+. “It would have been impossible even just five years ago.”
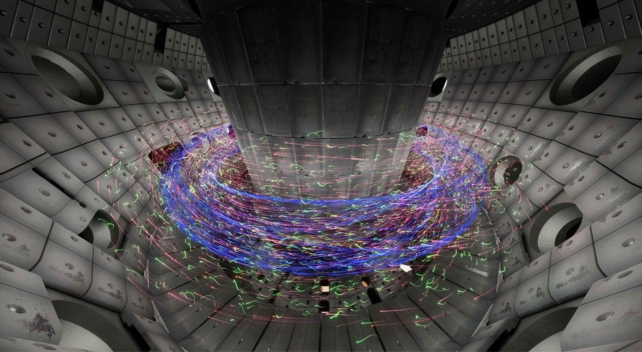
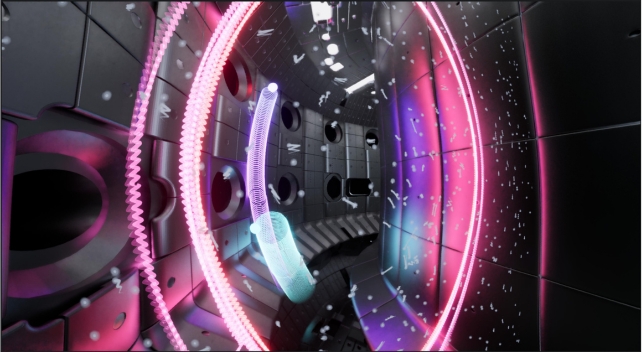
The result is realistic images of mind-blowing quality. You can see the injection device that deposits particles in the tokamak, as well as the graphite tiles capable of withstanding temperatures of over 100 million degrees Celsius.
And the scale of it all is impressive. To give viewers an idea, the visualization includes an image of a human being – the reactor is roughly twice their size. As the simulation unfolds, the viewer feels quite small as thousands of particles pass, spin, spin and chase each other.
Electrons are in red; protons are in green; and the blue lines indicate the magnetic field. Users can adjust each of the parameters to view a specific part of the reactor at a selected angle, with near-perfect rendering.
SPC director Paolo Ricci explains: “Visualization techniques are quite advanced in astrophysics, thanks in large part to planetariums. But in nuclear fusion, we’re just starting to use this technology – thanks mostly to the work we’re doing with EM+.”
Based on SPC’s excellence in this field, EPFL is involved in the International Thermonuclear Experimental Reactor (ITER) project and is a key member of the EUROfusion consortium.
In fact, EPFL was chosen to house one of the consortium’s five Advanced Computing Centers, giving the researchers involved in this EU-funded project an advanced tool to visualize their work.
Combining production and art
Kenderdine says the biggest challenge was “extracting tangible information from such a huge database to create a visualization that’s accurate, consistent and ‘real’ – even if it’s virtual.”
“The result is extraordinary, and I would even say beautiful, and it gives scientists a useful tool that opens up a range of possibilities.”
“The physics behind the visualization process is extremely complex,” says Ritchie.
“Tokamaks have many different moving parts: particles with heterogeneous behavior, magnetic fields, waves to heat the plasma, particles injected from outside, gases, etc.
“Even physicists have a hard time sorting it all out. The visualization developed by EM+ combines the standard output of simulation programs—basically tables of numbers—with real-time visualization techniques that the lab uses to create a video game-like atmosphere. “
In addition to SPC and EM+, three other EPFL groups participate in the Advanced Computing Hub: the Swiss Center for Data Science, the Institute of Mathematics and the Scientific IT and Application Support Unit (SCITAS).
This article was originally published by EPFL.